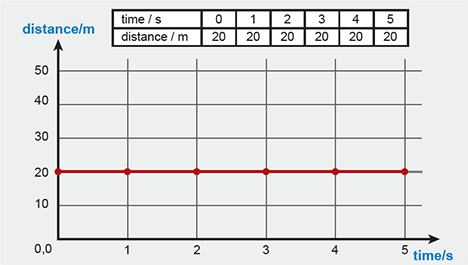
The following graph shows that time is going on but the object is at rest after travelling a distance of 20m.

If an object travels equal distances in equal time intervals, then graph will be a straight line as shown in the following graph. Body is moving with constant speed.
As the object is moving in the forward direction and a straight line passing through the origin, so slope of the graph is positive.

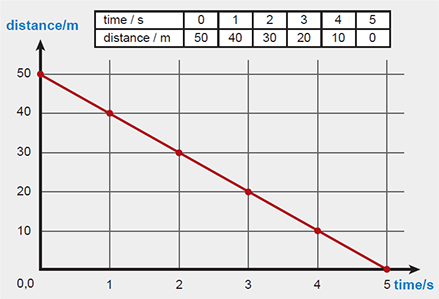
The following graph shows that the object has a steady speed in the opposite direction, the slope is negative, and so the value of the speed is negative.

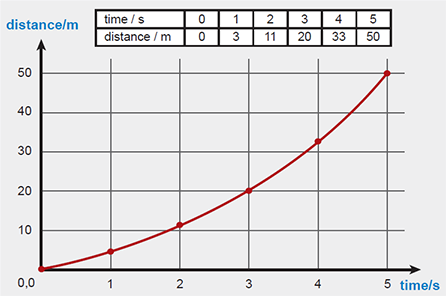
In the following graph, the body is accelerating because it travels larger distances in each next equal intervals of time.

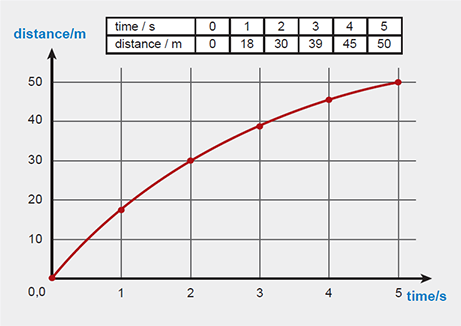
The following graph shows that the body is decelerating because it travels less distances in each next equal intervals of time.

In the following distance-time graph a car takes 5s to travel a distance of 50m at a constant speed of 10 m/s and stays at rest for next 7s at turning point. In the next 5s it returns back with the same speed of 10 m/s at the same starting point.

As the speed is same so it will travel same distance of 50m in forward and backward directions. So the total distance travelled by the car is 100 m

